
Zero Blind Spots: Combining OpenTelemetry Flexibility with IBM Instana Enterprise Intelligence
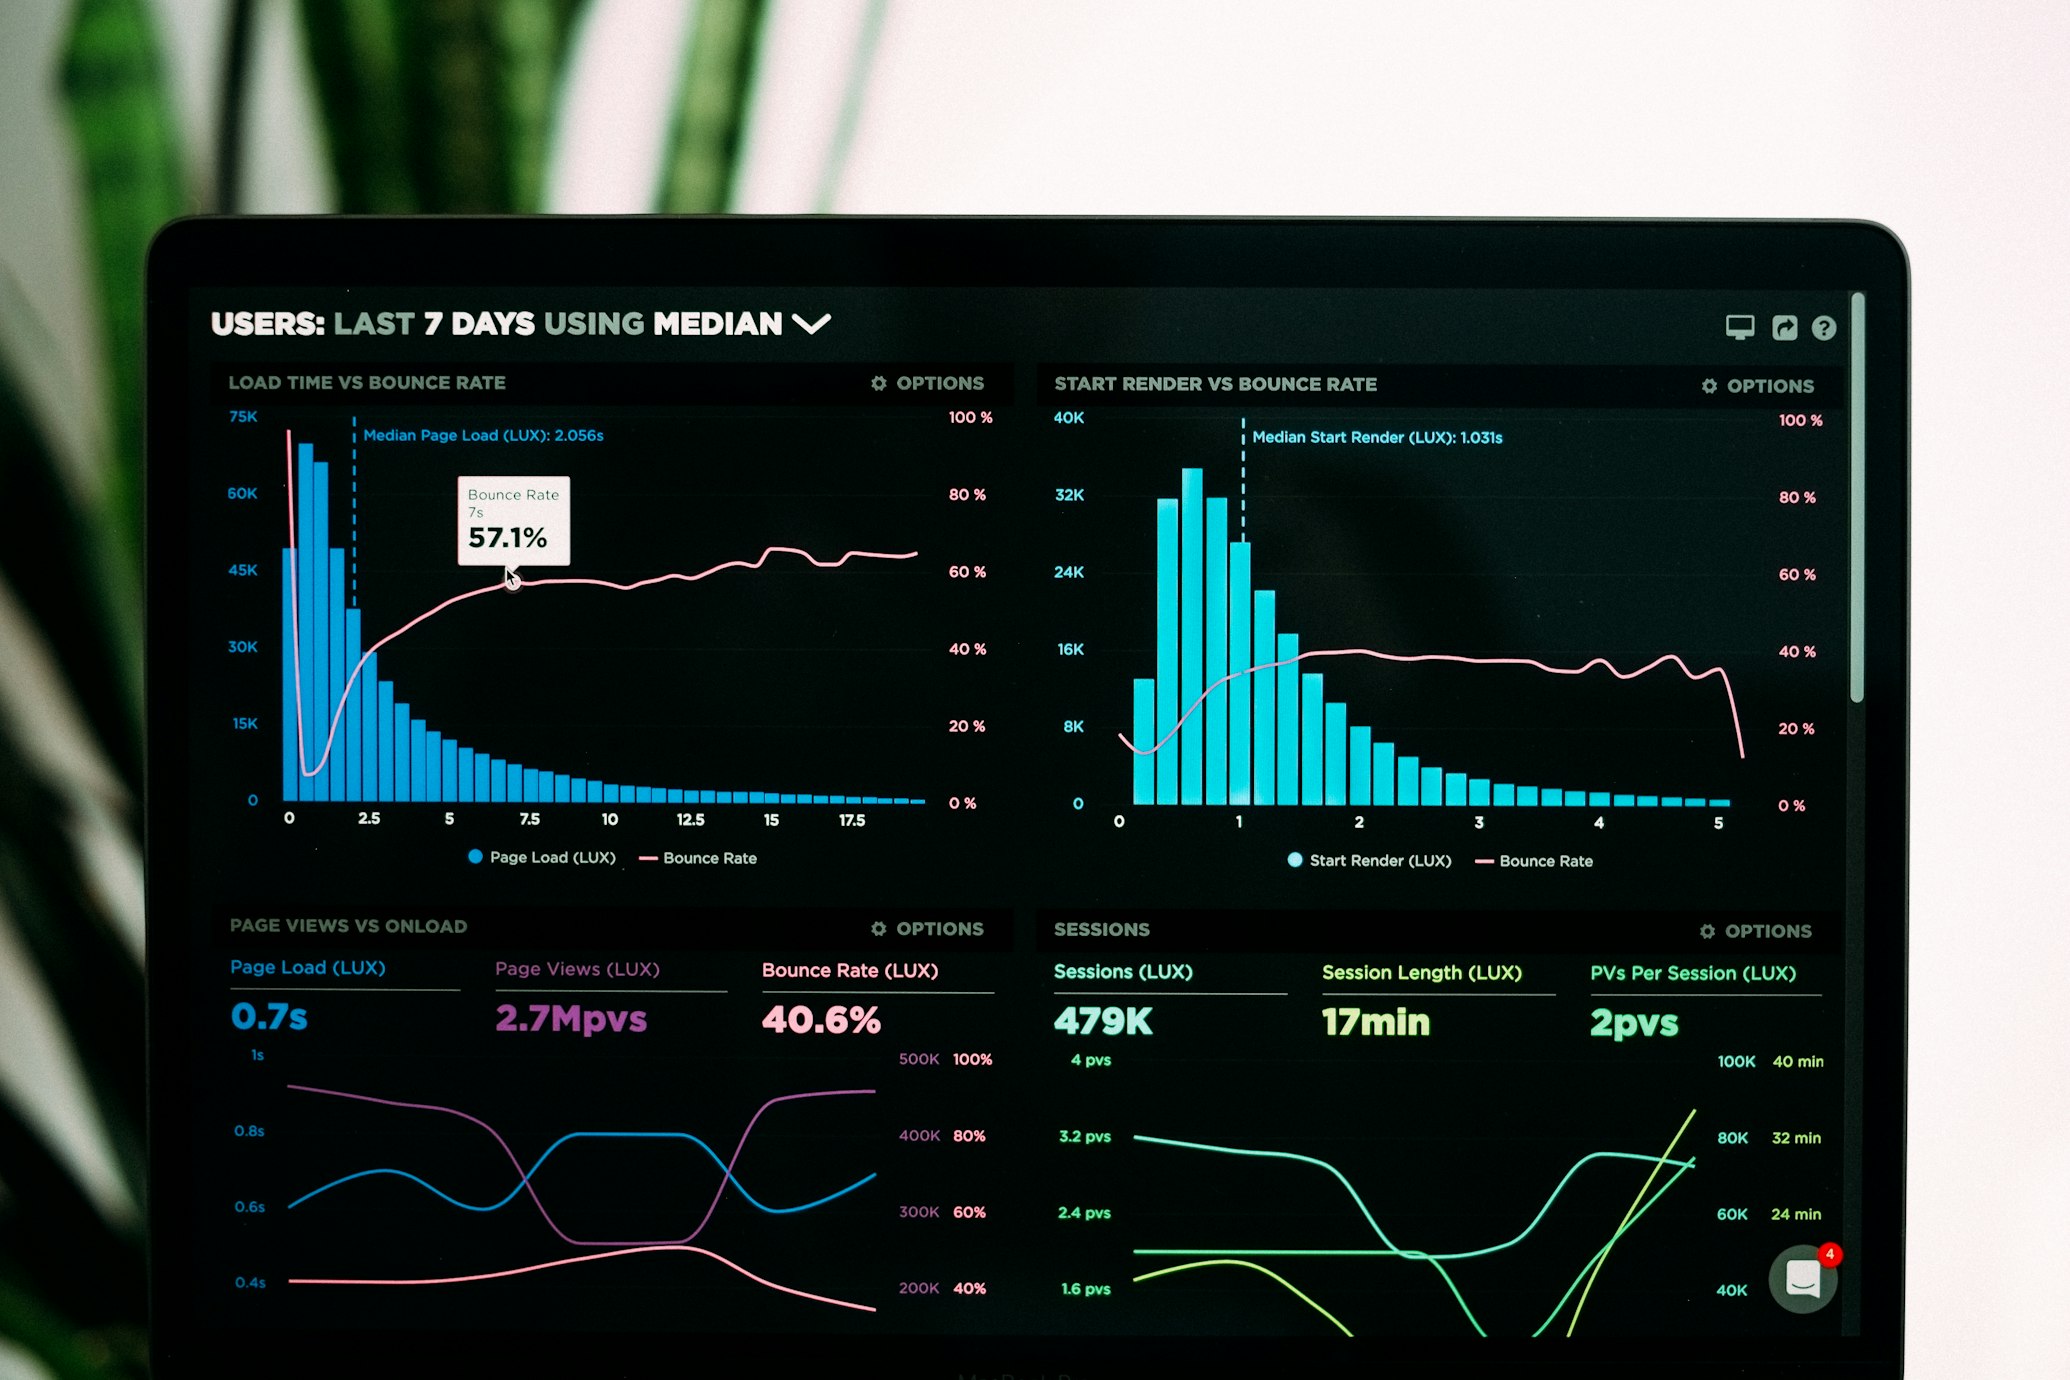
In modern cloud-native architectures, achieving true observability is a daunting task. While OpenTelemetry (OTel) has emerged as the undisputed open standard for generating and collecting telemetry data, raw data alone doesn't solve production incidents. By pairing OTel's vendor-neutral instrumentation with IBM Instana's automated context and enterprise intelligence, engineering teams can eliminate blind spots and drastically reduce Mean Time to Resolution (MTTR).
Why Pair OpenTelemetry with IBM Instana?
OpenTelemetry provides a unified set of APIs, libraries, and agents to capture distributed traces, metrics, and logs. It frees organizations from vendor lock-in at the instrumentation layer. However, OTel is a data collection framework, not an analytics engine.
IBM Instana excels where OTel leaves off. Instana automatically discovers application components, maps dependencies in real-time, and applies machine learning to detect anomalies. When you feed OTel data into Instana, you get the best of both worlds: custom, flexible instrumentation combined with automated root-cause analysis and a dynamic graph of your entire infrastructure.
The Architecture: Ingesting OTel into Instana
The integration architecture is straightforward. Applications instrumented with OpenTelemetry SDKs send their telemetry data (traces, metrics, logs) to an OpenTelemetry Collector. The Collector is then configured to export this data directly to the Instana backend or an Instana agent.
Instana natively supports the OpenTelemetry Protocol (OTLP). This means you can point your OTel exporters directly to Instana without needing complex translation layers or custom proxies.
Code Blueprint: Configuring the Setup
To get started, you need to configure your OpenTelemetry Collector to forward data to Instana. Below is a sample otel-collector-config.yaml demonstrating how to set up the OTLP receiver and the Instana exporter.
receivers:
  otlp:
    protocols:
      grpc:
        endpoint: 0.0.0.0:4317
      http:
        endpoint: 0.0.0.0:4318

exporters:
  instana:
    endpoint: "https://serverless-acceptor.instana.io/otlp"
    agent_key: "${env:INSTANA_AGENT_KEY}"

service:
  pipelines:
    traces:
      receivers: [otlp]
      exporters: [instana]
    metrics:
      receivers: [otlp]
      exporters: [instana]
Next, ensure your application is configured to send data to the collector. Here is a quick example using Node.js and the OpenTelemetry JS SDK:
const { NodeSDK } = require('@opentelemetry/sdk-node');
const { OTLPTraceExporter } = require('@opentelemetry/exporter-trace-otlp-grpc');
const { getNodeAutoInstrumentations } = require('@opentelemetry/auto-instrumentations-node');

const sdk = new NodeSDK({
  traceExporter: new OTLPTraceExporter({
    url: 'grpc://localhost:4317',
  }),
  instrumentations: [getNodeAutoInstrumentations()],
});

sdk.start()
  .then(() => console.log('Tracing initialized'))
  .catch((error) => console.log('Error initializing tracing', error));
Unlocking Advanced Features: Mixing Autotrace and OTel
One of the most powerful capabilities of Instana is its ability to seamlessly stitch together traces generated by its own AutoTrace agents with spans generated by OpenTelemetry. If you have a legacy Java application monitored by an Instana agent calling a new Go microservice instrumented with OTel, Instana will automatically correlate the trace context (using W3C Trace Context headers) and present a unified, end-to-end distributed trace in the dashboard.
Production Best Practices
When deploying this combined observability stack in production, keep these best practices in mind:
- Use the OTel Collector as a Buffer: Always route application telemetry through an OTel Collector rather than sending it directly to Instana. This allows you to batch, filter, and retry telemetry data, protecting your applications from network hiccups.
- Standardize Resource Attributes: Ensure all OTel SDKs inject consistent resource attributes (e.g.,
service.name,deployment.environment,k8s.namespace.name). Instana uses these tags to build its dynamic graph and group services logically. - Leverage W3C Trace Context: Ensure all your services propagate W3C Trace Context headers. This is critical for Instana to stitch together OTel spans with its own AutoTrace spans.
- Filter Noise at the Collector: Use the OTel Collector's processor components to drop health check spans or filter out PII before the data ever reaches the Instana backend.
Summary
By standardizing on OpenTelemetry for data collection and leveraging IBM Instana for analytics and automated root-cause analysis, engineering teams can build a future-proof observability strategy. This combination eliminates blind spots across hybrid environments, empowers developers with flexible instrumentation, and provides operations teams with the actionable intelligence needed to keep mission-critical systems running smoothly.